How to get the first 10 paying customers from a waitlist

A waitlist records interest in future access to a product. Membership alone does not show that someone will pay. The practical problem is smaller than growing the list. It is how to turn a fresh list into the first ten people who pay, before the names go cold.
Public numbers will not pick your price or your copy. They can supply reference points for scenario planning. Lenny Rachitsky's public summary of founder reports, dated 1 March 2022, puts paid conversion from a waitlist between 5 percent and 25 percent, near 20 percent when people are let in within a month, and below 10 percent when they wait more than three months. Gaurav Vohra, writing on 24 June 2025 about the Superhuman waitlist he ran, puts a live signup at about 10 percent paying within seven days and a waitlist signup at about 3 percent, for people who had already waited about six months. Use those rates to explore possible batch sizes, while checking whether their definitions match your own. Do not use them as a promise that your tenth payment will arrive on a chosen date.
What each percentage is counting
A conversion rate is a fraction. Change the denominator and you are talking about a different event.
Lenny separates conversion to a paid account from conversion to a free signup. A person who creates a free account does not necessarily pay. He also separates physical products, where the few reports he had were all below 5 percent once the product was widely available. His public summary does not provide a consistent denominator or payment window for every founder report. Do not assume all founders counted everyone invited, everyone registered, or everyone on the original list in the same way.
Vohra labels both paths as conversion to paying within seven days. He also says the waitlist group had already waited about six months. The essay does not explain exactly which event starts that seven day clock. Treat the labels as reported, without inventing an invitation or account-creation rule. The 3 percent figure is not a measurement of eventual conversion from the whole list.
The ChartMogul conversion report, by Kyle Poyar with ChartMogul and ProductLed, published 4 February 2026, uses a third definition. The survey asked what percentage of leads or free signups become a paying customer within six months. That is not a waitlist-specific measure. A waitlist address might also be called a lead, so the labels alone do not establish equivalent populations or starting events. The median answer across the products in that survey was 8 percent. Very few products sat on that median. The report says there is a ten times gap between the top 20 percent of self serve products and the bottom 20 percent.
If your analytics tool uses one word for all three, split them before you decide the list is converting.
What founders reported, and what they did not
The post is What is good waitlist conversion, 1 March 2022. The method, in the public text, is that he asked founders over Twitter, by email, and in person, people with direct experience of long waitlists. The public text does not say how many founders answered, whether they were chosen at random, or what each founder counted as the denominator. The rest of the post, including the section on factors that change the rate, is limited to paying subscribers. This guide uses only the public summary.
That summary has three lines.
For a free signup, rates ranged from 25 percent to 85 percent. The average he states is around 50 percent if people get off the waitlist in under a month, and below 20 percent if they wait over three months.
For a paid account, rates ranged from 5 percent to 25 percent. The average he states is around 20 percent if people get off the waitlist in under a month, and below 10 percent if they wait over three months.
For a physical product, he says he had only a few data points, and all of them were below 5 percent once the product rolled out widely. A software invite and a shipped object are not the same offer. Do not borrow the software average for a thing you have to manufacture.
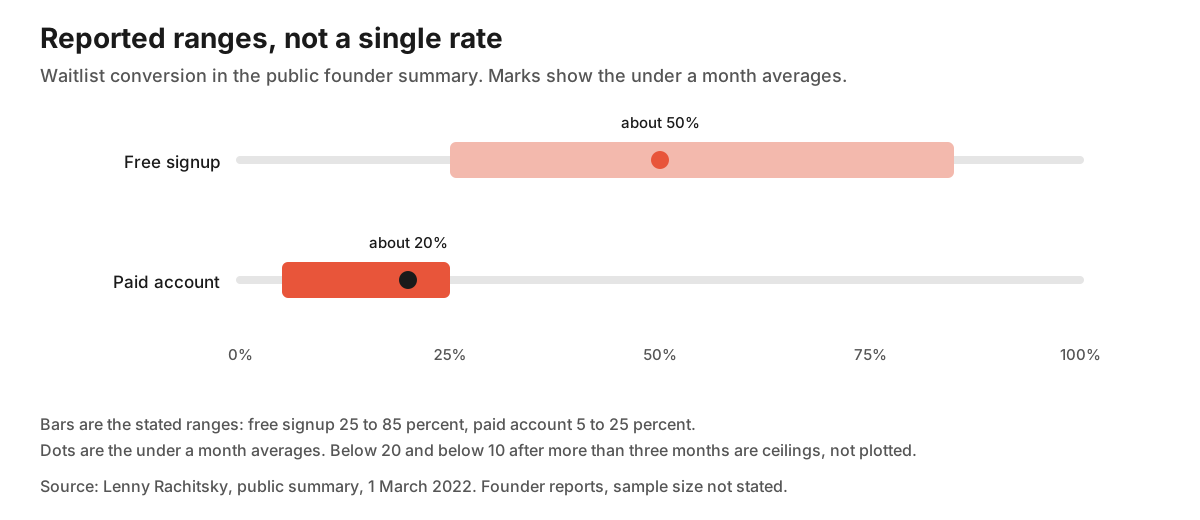
The chart draws the two ranges and the two around marks for the under a month case. It does not draw the below 20 and below 10 lines as if they were measured points. A ceiling is not a result. The page also includes a summary image. Its labels are not repeated as text, so they are not used here.
Read the paid range as a spread of founder reports, not a target for one standardized invitation. The endpoints do not tell us that the same offer, audience or measurement method produced both results. The post does not show that moving faster caused the higher rate. Founders who can invite within a month may also have a product people already want. Timing may overlap with demand, product readiness and audience selection; the public summary does not separate these factors.
Model ten expected payments
The useful calculation for a small product is a hypothetical batch size. Choose a conversion probability for your own invited cohort, then divide 10 by that rate. This gives a batch with an expected total of ten payments under that assumption. It does not give the number of invitations that guarantees a tenth payment.
The tables below borrow reported percentages as scenario inputs. That is an editorial model, not evidence that the sources measured conversion per invitation. Real results can fall above or below the expectation, and the source methods may differ from yours.
| Scenario rate | Source reference | Batch size for 10 expected payers |
|---|---|---|
| 25 percent | Top of the paid range Lenny states | 40 |
| 20 percent | The around 20 figure for under a month | 50 |
| below 10 percent | The later average is below this threshold | more than 100 |
| 5 percent | Bottom of the paid range he states | 200 |
Ten divided by 0.25 is 40. Ten divided by 0.20 is 50. Ten divided by 0.05 is 200. At a rate below 10 percent, the model requires more than 100 people for an expected ten payments. These rows are arithmetic on stated percentages. They are not measured invitation counts or a guarantee that a batch will produce ten customers.
Two cautions belong next to the table. First, the source says around 20 percent, so 50 is a rough working figure. Second, your model needs its own denominator. If you choose invited addresses, count every address in that defined batch, including people who never create an account. Do not quietly replace that denominator with the smaller group that opened the email or started the product. Lenny does not publish enough detail to establish a direct comparison with that invitation-based measure.
Vohra's reported percentages can supply another set of scenario inputs. Keep them separate from Lenny's figures, because his labels specify seven days while Lenny's public summary supplies no common payment window. The starting event in Vohra's account also remains unspecified.
| Scenario rate | Source reference | Rounded batch size for 10 expected payers |
|---|---|---|
| about 10 percent | Live signup, his comparison | 100 |
| about 3 percent | Waitlist signup after about 6 months | 334 |
| 1.5 percent | One year further back, as he states the decay | 667 |
| 0.8 percent | The next step he states | 1,250 |
Ten divided by 0.10 is 100. At 0.03, round the required whole-person batch up to 334. At 0.015, round up to 667. At 0.008, the result is 1,250. This is arithmetic on approximate source values. Vohra does not publish these headcounts, and a batch this size can still produce fewer than ten payments.
For an illustrative batch of 80 people, a 20 percent assumption gives 16 expected payments. A 5 percent assumption gives 4, and a 3 percent assumption gives 2.4. These are expectations, not limits on what can happen in one small group. A batch with a low expected count can still produce ten payments. The practical use is to see how sensitive your plan is to the assumed rate, then collect your own results instead of treating a benchmark as a quota.
The Superhuman comparison
Vohra's essay is The Waitlist Delusion, 24 June 2025. He writes that he ran Superhuman's waitlist from start to finish, and that it accrued well over 500,000 signups. The comparison that matters for the first ten payments is not that total. A large total is what he later calls a weak proxy for demand, retention, and revenue.
He says he could compare the waitlist with the live funnel because both were running at the same time. Waitlist signup to paying customer within seven days was about 3 percent. Live signup to paying customer within seven days was about 10 percent. He describes the live path as more than three times the waitlist path. Ten divided by three is about 3.3, which matches the direction of more than three times, and it is the same pair of rates. He states that there were no other differences in the populations, and that the only difference was that the waitlist had been made to wait. The essay does not publish the number of signups in each group, so a reader cannot judge how stable those two percentages are. Treat them as his account of a comparison he could see, not as a trial with a published sample size.
He then ties the 3 percent to age. That rate was for signups who had been on the waitlist for approximately six months. He describes conversion as roughly halving for each year further back, from 3 percent to 1.5 percent to 0.8 percent. He writes 0.8, not a fresh halving that you should recompute. Half of 1.5 is 0.75. The figure in the essay is 0.8. Use 0.8.
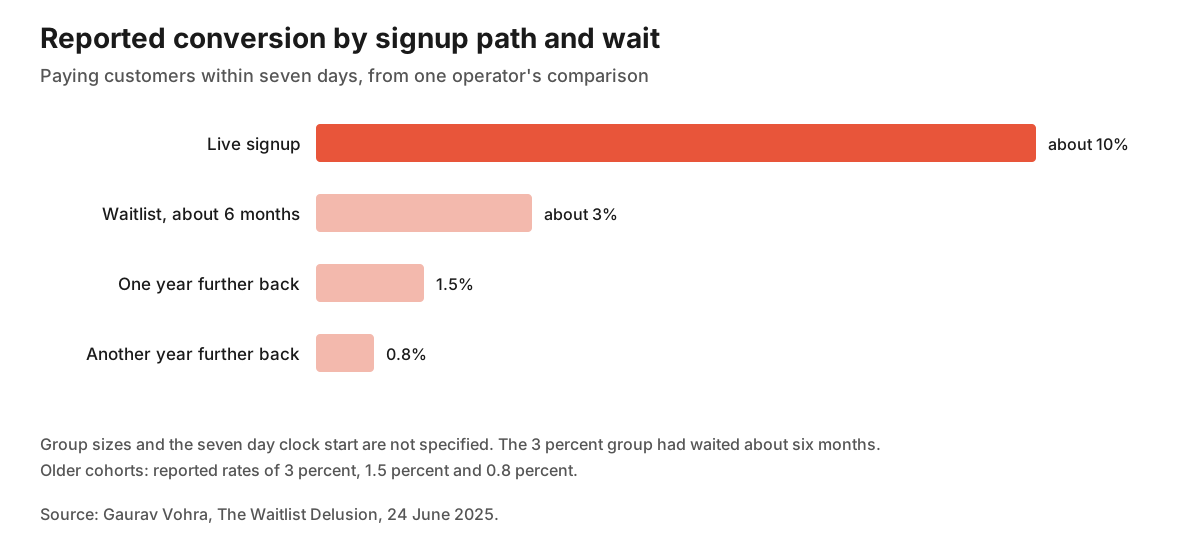
The chart is those four rates and nothing else. It does not show visits, revenue, or how many of the original waitlist signups were in the comparison. It also does not prove that waiting caused the drop. He says the populations did not otherwise differ. That is his claim about a comparison without a methods appendix. A reader can still see the planning consequence he draws. A waitlist that stays up for years is a different offer from a waitlist that clears in a few months. He writes that waitlists should exist for a few months at most, and that anything longer hurts conversion by more than three times. The more than three times line is the live path against the waitlist path in this essay, not a study of many companies.
The same essay is blunt about extra mail. He says customers who signed up for a service do not want to be kept entertained. There is rarely a message worth sending a waitlisted person other than an invite to the product. Questions about webinars, contests, and hiring someone to grow the list are, in his account, a sign the list has become the work. For the first ten payments, that supports prioritizing useful invitations. It does not establish that every other kind of email is ineffective. Later in the same essay, he supports nurturing people with lower intent while giving those ready to buy an immediate path.
He also limits when a waitlist is even the right tool. His condition is a real supply constraint that stops you from delivering the experience you intend. He names three forms. A hard constraint is capacity you do not have, such as hardware units, seats, or a platform you do not support. A soft constraint is quality you have not reached, such as missing use cases or a bug list you will not hand to more people yet. A service constraint is teammates you do not have, such as implementation help or support. In all three, he says removing the constraint is the growth work. He treats optics, brand and hype as possible secondary benefits, rather than the primary rationale.
Do not paste a trial rate onto the list
Kyle Poyar's ChartMogul and ProductLed report supplies useful context, but it asks a different question. Its January 2026 survey collected 200 responses, asking respondents to estimate the share of leads or free signups that became paying customers within six months. The median was 8 percent. Specific chart samples can be smaller than the full survey.
That definition does not establish a conversion rate for a queue of people awaiting access. A lead could include someone on a waitlist, but the report does not isolate those people. Nor does the public waitlist summary establish the same six month payment window. Combining their percentages as successive funnel stages would require a shared population and compatible stage definitions that these reports do not provide.
For trials without a credit card, the report labels 4 to 6 percent good and 10 to 15 percent great. With a required card, it gives 25 to 35 percent and 50 to 60 percent. Its chart defines those labels as the 50th and 75th percentiles. It also notes that requiring a card may reduce signups. These are differences between surveyed products, not proof that adding a card will improve your own results.
If a waitlist invite leads to a trial, measure two steps separately: invitation to trial start, then trial start to payment within a defined window. Do not multiply unrelated benchmarks and present the result as a forecast. If you are still choosing the free allowance, the freemium pricing examples show how other makers describe what is free and what is paid. Settle that sentence before writing the invitation.
What to do with the names you have
The essays do not hand you a script. They do rule a few plans out.
Invite while the list is young. The founder summary reports lower averages for waits over three months than for waits under a month. The seven day rates in the Superhuman account drop as the waitlist ages by years. If you already have names from last quarter, the honest plan is a small invite now, not a campaign to collect more names first. Vohra is explicit that hiring to grow the waitlist chases a weak proxy for revenue.
Send the invite, not a tour of the company. His line is that there is rarely another message worth sending. One email can say who the product is for, what they can do today, the price, and a single link. The product launch checklist already includes that note to people who asked for updates: who it helps, what it does, one link, and claims you can keep today. The product description examples are a check on the sentence you put in that email. If a stranger cannot repeat who it is for, the invite is not ready.
Do not treat a launch directory as the conversion plan. Where to launch a SaaS is about being found. Directory visibility can create interest, but it does not establish a waitlist conversion rate. Plan how interested visitors will reach a paid offer, as well as where they will discover it.
Let high intent people in first, if you can tell who they are from something they already did. Vohra's alternative to forcing everyone to wait is an immediate path for high intent people, alongside continued nurturing for people with lower intent. As an editorial rule of thumb, you could prioritize someone who asked about price or described a concrete use case. A security question or a reply is context to investigate, not proof that someone will buy. The essays do not give a score formula. They do say not to hold every address back in order to educate a few of them.
Keep a supply reason, or do not keep the list. If you can onboard the next person without breaking the experience, his argument is to stop using the waitlist. If you cannot, name the constraint in the invite. Saying you are letting in a small batch because setup is still done by hand is a supply sentence. Bragging about how many people are waiting is a size sentence. He treats the size sentence as the trap.
The following record is an editorial working log, not a result from either essay. Before sending, record when the person joined and when you plan to invite them, and define your measurement window. After sending, add the actual invitation date and any payment outcome.
- The date they joined.
- The date you invited them.
- Whether they paid, and the date of payment.
- The start event and length of your payment window. Seven days and six months are possible lengths. A matching length alone does not make your cohort comparable with either source. Define your own start event, such as the invitation being sent, before you send, and do not change it after a payment lands.
Ten payments inside the window is the goal. For your invitation-to-paid measure, use all 40 people in a defined example batch as the denominator. If 4 pay inside the chosen window, the observed rate is 10 percent. People who never register still belong in that invitation cohort. Only compare it directly with another rate when the denominator, starting event and observation window match. A seven day result compared with a six month survey result is not a verdict on your product.
If the invite leads to a free plan, count the free start and the payment separately, the way the founder summary separates them. A free account is progress only if your model says the free account is supposed to come first. A free account does not meet a paid-customer goal, even when a free trial is an intended step toward payment.
If you change the price, the page and the invite audience together, record each change. You can still calculate a rate, but you cannot isolate which change explains a difference from the previous batch. Even when you hold those choices steady, small groups and changing demand leave uncertainty.
A short checklist
Answer these in writing before you ask the list for money.
- Is there a real supply constraint, or are you keeping the list for appearance?
- What is the paid event, and what clock does it use?
- How many people will you invite this month, and which reported rate did you use only as a scenario input?
- Does the email offer the product, with price and one link, rather than a request to keep waiting?
- Can you list join date, invite date, and payment date for every person in the batch?
- If the path is a free plan or a trial, have you said what is included before you send the link?
A long waitlist can be real and still be a poor plan for the first ten payments. The public reports associate longer waits with lower conversion, without establishing a universal causal effect. Invite the people you already have, count the payments on one clock, and retire the list when the constraint is gone.
Sources
Pages were opened before this was written. Charts use only figures printed on those pages. Headcounts for ten payers are 10 divided by the stated rate, shown in the tables, and are not extra measurements.
- Lenny Rachitsky, What is good waitlist conversion, 1 March 2022. Public summary of founder reports gathered over Twitter, by email, and in person. Free signup from 25 to 85 percent, around 50 percent if people are let in within a month, below 20 percent after more than three months. Paid account from 5 to 25 percent, around 20 percent within a month, below 10 percent after more than three months. Physical products below 5 percent in the few reports he cites, once widely available. The number of founders and the later factors section are not in the public text.
- Gaurav Vohra, The Waitlist Delusion, 24 June 2025. Superhuman live signup about 10 percent and waitlist signup about 3 percent, both labeled paying within seven days. The waitlist group had waited about six months, followed by 1.5 percent and 0.8 percent for each further year as he states it. The clock start is not specified. He says the live path was more than three times the waitlist path and that the groups did not otherwise differ. The essay does not give group sizes. The waitlist totaled well over 500,000 signups. He says a waitlist needs a supply constraint, should last a few months at most, and that an invite is the message worth sending.
- Kyle Poyar with ChartMogul and ProductLed, The Conversion Report, 4 February 2026. January 2026 survey with 200 responses. Estimated conversion of leads or free signups to paying customers within six months. Charts can use smaller subsets. Median 8 percent, with trial benchmarks segmented by card requirement. This is not a waitlist study.
The cohort record, scenario calculations and checklist are editorial. They are not findings from the three sources.
0 replies
Sign in to join the discussion
Log in