I tagged every support ticket for six months. It replaced my roadmap
generalHere's a thing almost nobody checks. You count your support tickets by category, you rank the categories, and you build whatever sits at the top. But ticket counts are random, and if you don't know how random, you can't tell a real pattern from a month that happened to go that way.
The good news is there's a clean answer. Tickets arriving independently over a month follow a Poisson distribution, and for that the standard deviation is just the square root of the mean.
That one fact tells you most of what you need.
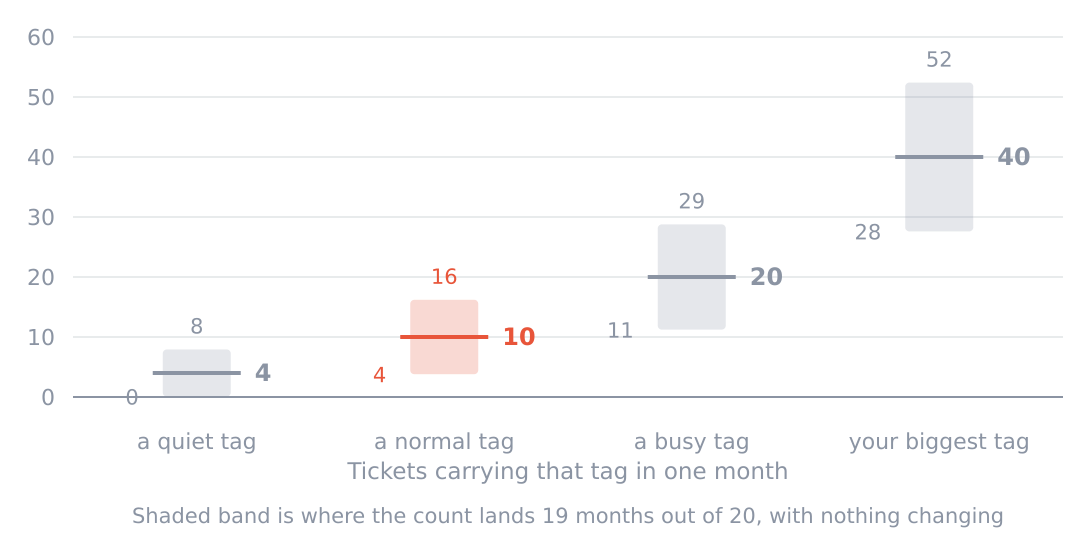
Nothing changes between months. This is the range you get anyway.
| Tickets a month | Standard deviation | Where it lands 19 months in 20 |
|---|---|---|
| 4 | 2.0 | 0 to 8 |
| 10 | 3.2 | 4 to 16 |
| 20 | 4.5 | 11 to 29 |
| 40 | 6.3 | 28 to 52 |
Look at the ten row. A tag that genuinely averages ten tickets a month will show you four in one month and sixteen in another, with nothing whatsoever having changed. If you saw those two months side by side you'd have a theory about what happened between them. There'd be nothing to explain.
What this does to your ranking
Say two tags come in at twelve and eight. Feels clear. Twelve is fifty percent bigger.
Run the numbers. The difference is four, and the standard deviation of that difference is the square root of twelve plus eight, which is about 4.5. Your difference is smaller than its own noise. You've learned nothing.
To be reasonably confident twelve really does beat eight, you need about five months of data.
| Months of data | How strong the signal is | Verdict |
|---|---|---|
| 1 | 0.89 | Coin flip |
| 2 | 1.26 | Still a coin flip |
| 3 | 1.55 | Suggestive, not solid |
| 4 | 1.79 | Nearly |
| 5 | 2.00 | Now you can say it |
Five months to separate twelve from eight. That's what it costs, and it's why I use a three month rule as a floor rather than a proof. Three months isn't enough to rank neighbours. It is enough to spot a tag that's four times the size of its neighbours, and in practice that's the only kind of gap worth acting on anyway.
So count differently
This changes what you should be doing with the numbers.
Don't rank. Group. Sort your tags into rough tiers, something like dominant, ordinary and rare, and stop pretending you can order things inside a tier. The gap between your biggest tag and your fifth biggest is real. The gap between third and fourth is a coin landing.
Watch the total, not the share. If your ticket volume doubles, every tag count roughly doubles, and a tag whose share went from twenty to eighteen percent may still have doubled in absolute pain. Percentages hide this. Counts don't.
Set the bar at a multiple, not a difference. My rule is that a tag has to be at least twice the size of the tier below it before I treat it as separate. Twice is roughly where the noise stops being able to explain the gap at these volumes.
The method itself
One tag per ticket, chosen before I write the reply.
The single tag part matters more than it looks. When I allowed several, everything got tagged three or four ways, every count rose together, and the ranking became meaningless. Forcing one choice makes me decide what the ticket is actually about, and that small piece of thinking is the only thing standing between a tag list and a shrug.
New tags whenever I need them. If a ticket fits nothing, that's a finding rather than an inconvenience.
Four seconds a ticket. One hour a month to count. It lives in a spreadsheet because the two proper tools I tried both made tagging expensive enough that I skipped it on busy days, and a log with holes in it is worse than no log, since you can't tell a quiet month from a lazy one.
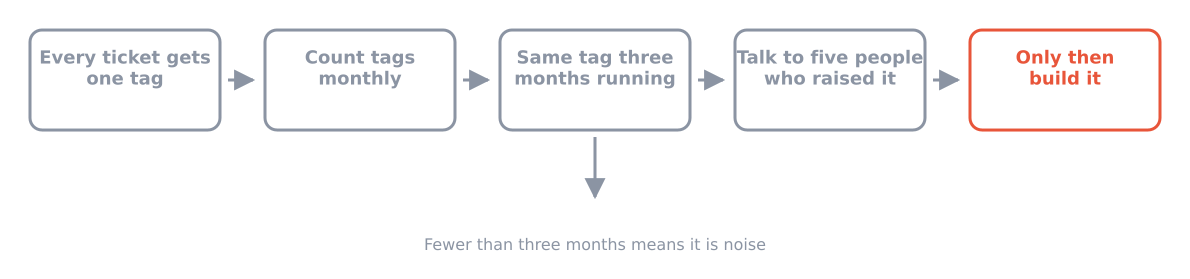
Counting tells you where to look. It doesn't tell you what to build.
What six months looked like
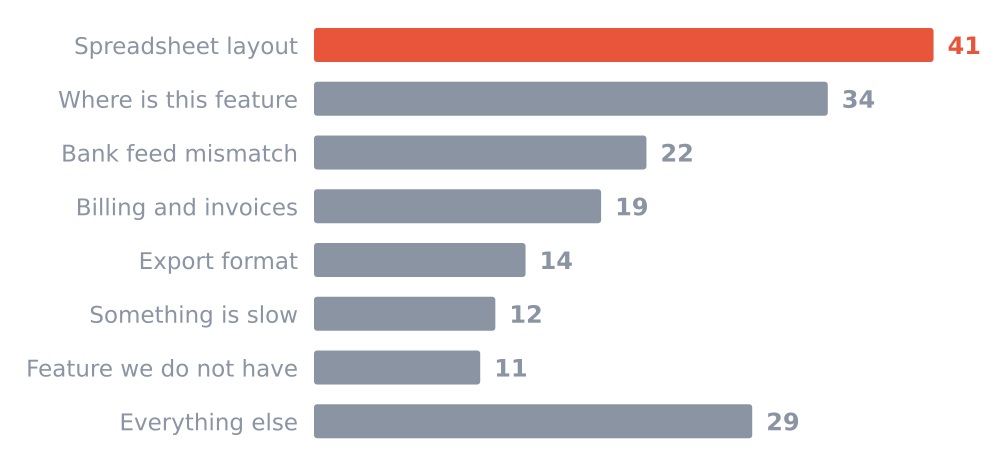
182 tickets. Only the top bar is unambiguously ahead of the pack.
The finding I'd never have got any other way is the second bar. Thirty four people wrote asking where something was, and every single feature they were looking for already existed. That isn't a roadmap item, it's a layout problem, and counting feature requests instead of tickets would have hidden it completely.
Renaming one menu item removed about a quarter of those. Eleven minutes of work. Best return I got all year, and it came from a tag I'd have never created if I were only logging things I thought I might build.
The step I skipped once
Three months of a tag doesn't mean build it. It means go and talk to five of the people who raised it.
I skipped that on the export tag. Fourteen tickets across three months, all asking for exports, so I built exports. Almost nobody used it, because the fourteen people wanted three different things and I'd built the average, which suited none of them.
When I finally called five of them, eleven of the fourteen turned out to want the same specific thing. Two days to build. Used immediately. The average had taken a week.
Counts point at a door. They don't tell you what's behind it, and treating a count as a specification is how you ship the mean of several incompatible requests.
What this method can't see
Two blind spots, and both are worse than the method is good.
It only sees people who write to you. Everybody who hit the same wall and quietly left is missing from the data, and from calling churned customers I know that group is bigger. Worse, it's biased in a specific direction, because giving up silently is what people do when something is badly broken rather than mildly annoying. Your tag counts are the visible half, and it's the milder half.
And it can't tell you about anything you haven't built. Nobody sends a ticket about the feature that doesn't exist and that they haven't imagined. Every genuinely new thing in my product came out of a conversation.
So the tags decide what to fix, and roughly in what order. They've never once told me what to make.
0 replies
Sign in to join the discussion
Log in